Demo R Markdown - Tue, Dec 1, 2020
R Markdown
This is an R Markdown document. Markdown is a simple formatting syntax for authoring HTML, PDF, and MS Word documents. For more details on using R Markdown see http://rmarkdown.rstudio.com.
You can embed an R code chunk like this:
summary(cars)
##      speed           dist
##  Min.   : 4.0   Min.   :  2.00
##  1st Qu.:12.0   1st Qu.: 26.00
##  Median :15.0   Median : 36.00
##  Mean   :15.4   Mean   : 42.98
##  3rd Qu.:19.0   3rd Qu.: 56.00
##  Max.   :25.0   Max.   :120.00
fit <- lm(dist ~ speed, data = cars)
fit
##
## Call:
## lm(formula = dist ~ speed, data = cars)
##
## Coefficients:
## (Intercept)        speed
##     -17.579        3.932
Including Plots
You can also embed plots. See Figure 1 for example:
par(mar = c(0, 1, 0, 1))
pie(
  c(280, 60, 20),
  c('Sky', 'Sunny side of pyramid', 'Shady side of pyramid'),
  col = c('#0292D8', '#F7EA39', '#C4B632'),
  init.angle = -50, border = NA
)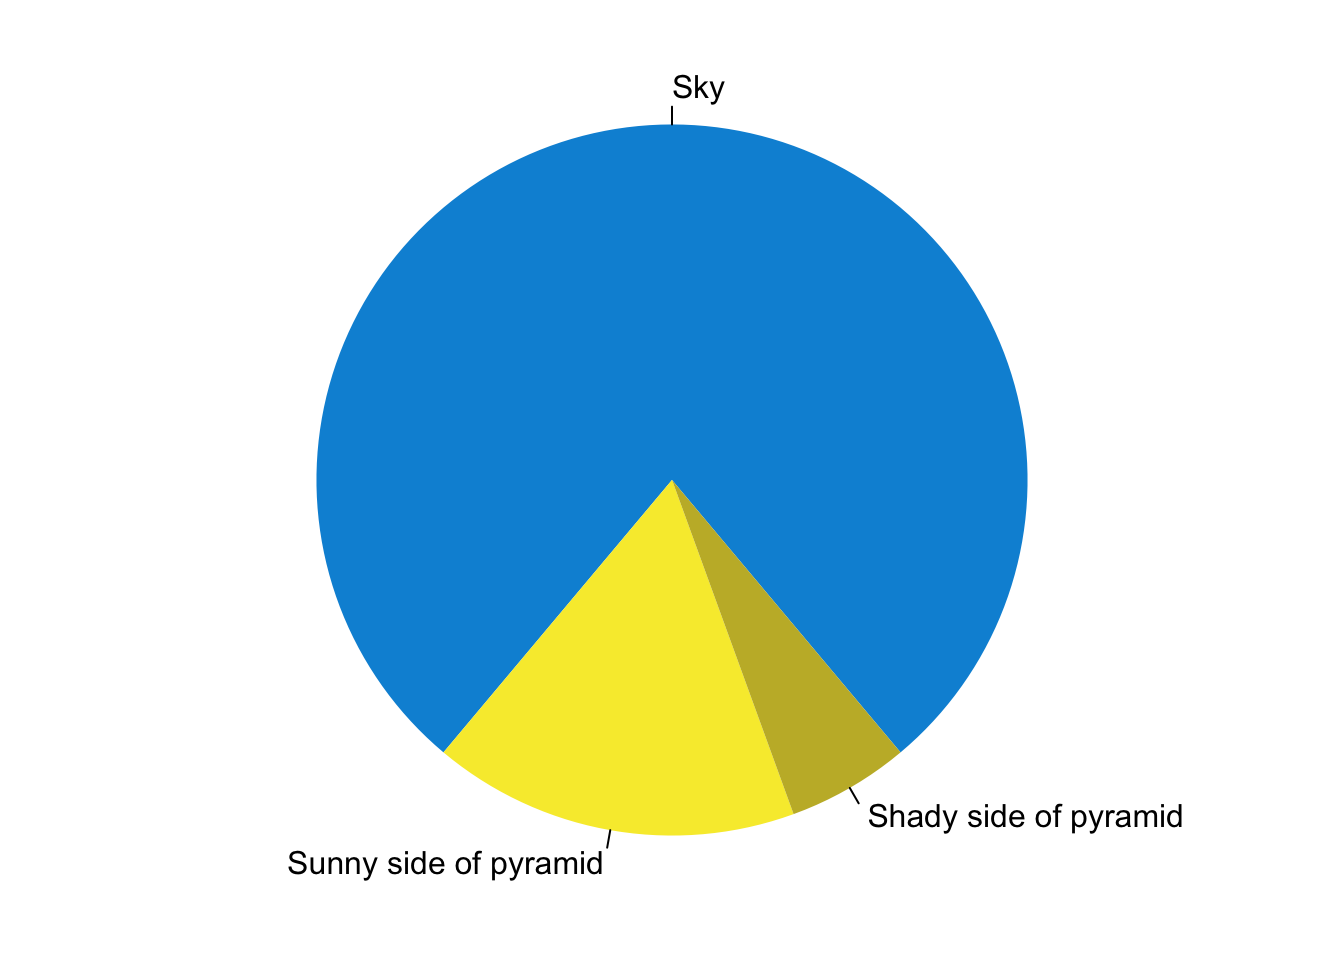
Figure 1: A fancy pie chart.
summary(Orange)
##  Tree       age         circumference
##  3:7   Min.   : 118.0   Min.   : 30.0
##  1:7   1st Qu.: 484.0   1st Qu.: 65.5
##  5:7   Median :1004.0   Median :115.0
##  2:7   Mean   : 922.1   Mean   :115.9
##  4:7   3rd Qu.:1372.0   3rd Qu.:161.5
##        Max.   :1582.0   Max.   :214.0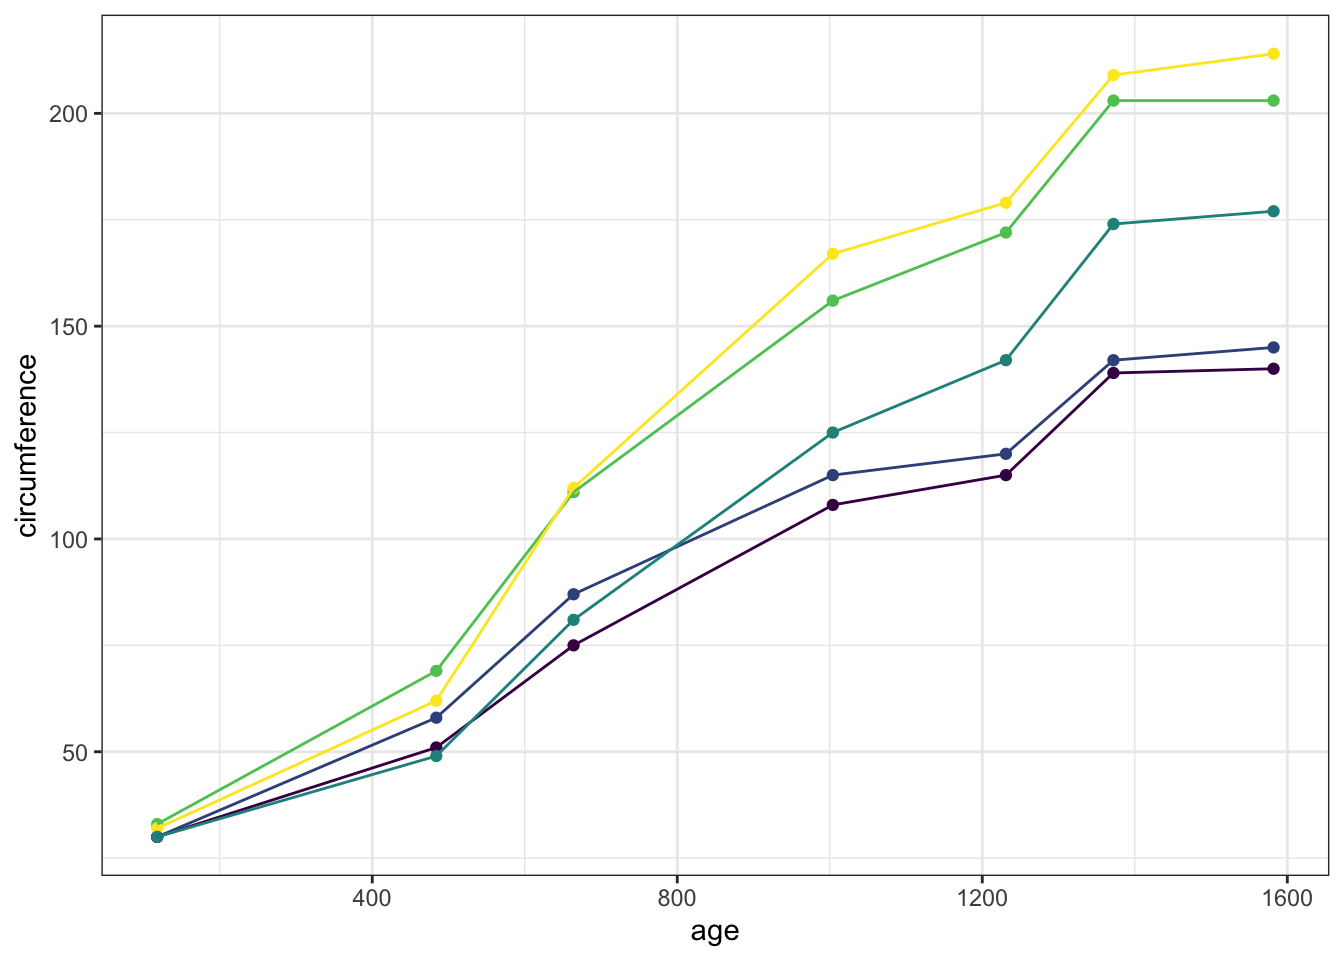
Some math
\(x = 0\), but with \[\begin{equation} f(x) = \sum_0^n t_i \tag{1} \end{equation}\]
Oh, and (1).
A table
R table:
knitr::kable(
  mtcars[1:6, 1:6], caption = 'A subset of mtcars.',
  table.attr = "class=\"table\"", format = "html"
)| mpg | cyl | disp | hp | drat | wt | |
|---|---|---|---|---|---|---|
| Mazda RX4 | 21.0 | 6 | 160 | 110 | 3.90 | 2.620 |
| Mazda RX4 Wag | 21.0 | 6 | 160 | 110 | 3.90 | 2.875 |
| Datsun 710 | 22.8 | 4 | 108 | 93 | 3.85 | 2.320 |
| Hornet 4 Drive | 21.4 | 6 | 258 | 110 | 3.08 | 3.215 |
| Hornet Sportabout | 18.7 | 8 | 360 | 175 | 3.15 | 3.440 |
| Valiant | 18.1 | 6 | 225 | 105 | 2.76 | 3.460 |
And MD table:
| Right | Left | Default | Center |
|---|---|---|---|
| \(x\) | 12 | 12 | 12 |
| \(y\) | 123 | 123 | 123 |
| \(z\) | 1 | 1 | 1 |
Plotting with Python
import numpy as np
import matplotlib.pyplot as plt

a = np.arange(0, np.pi, 0.1)
plt.plot(a, np.cos(a))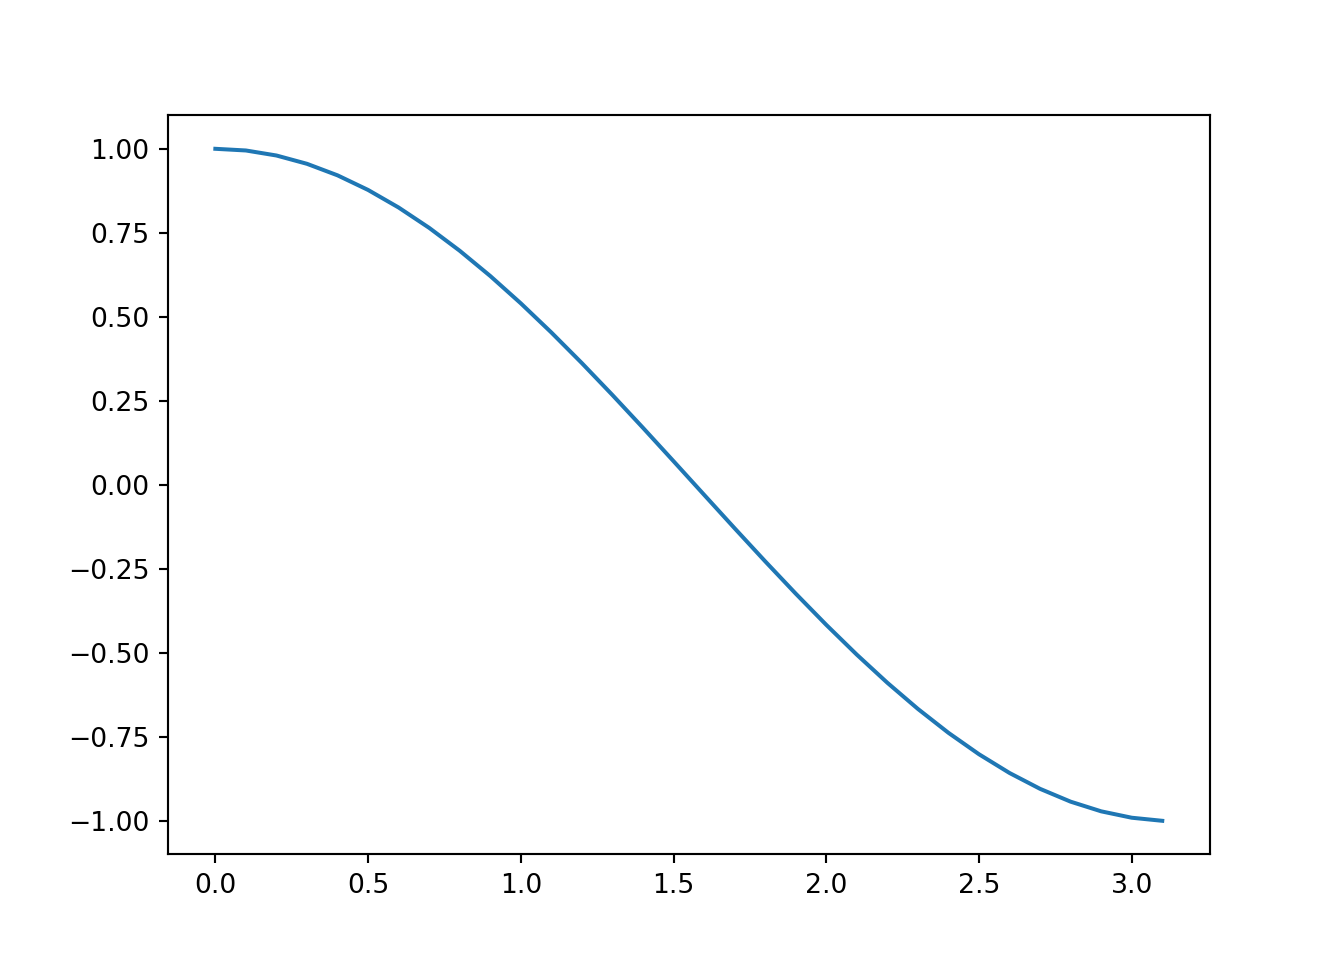
Figure 2: A cosine function
Fig. 2 shows a common function in practice, the cosine function.
We should also be able to get some pandas dataframes working:
import pandas
import seaborn as sns

iris = sns.load_dataset('iris')
print(iris.head().to_html(classes=['table']))| sepal_length | sepal_width | petal_length | petal_width | species | |
|---|---|---|---|---|---|
| 0 | 5.1 | 3.5 | 1.4 | 0.2 | setosa |
| 1 | 4.9 | 3.0 | 1.4 | 0.2 | setosa |
| 2 | 4.7 | 3.2 | 1.3 | 0.2 | setosa |
| 3 | 4.6 | 3.1 | 1.5 | 0.2 | setosa |
| 4 | 5.0 | 3.6 | 1.4 | 0.2 | setosa |
Syntax highlighting
Let try some fancy C++17 (with retro vibes).
#include <cstdlib>
#include <iostream>
#include <set>
#include <string>
#include <iterator>

#include <tuple>

// {
struct S {
    int n;
    std::string s;
    float d;
    bool operator<(const S& rhs) const
    {
        // compares n to rhs.n,
        // then s to rhs.s,
        // then d to rhs.d
        return std::tie(n, s, d) < std::tie(rhs.n, rhs.s, rhs.d);
    }
};
// }

int main()
{
    std::set<S> mySet;

    // pre C++17:
    {
        S value{42, "Test", 3.14};
        std::set<S>::iterator iter;
        bool inserted;

        // unpacks the return val of insert into iter and inserted
        std::tie(iter, inserted) = mySet.insert(value);

        if (inserted)
            std::cout << "Value was inserted\n";
    }

    // with C++17:
    {
        S value{100, "abc", 100.0};
        const auto [iter, inserted] = mySet.insert(value);

        if (inserted)
            std::cout << "Value(" << iter->n << ", " << iter->s << ", ...) was inserted" << "\n";
    }
}